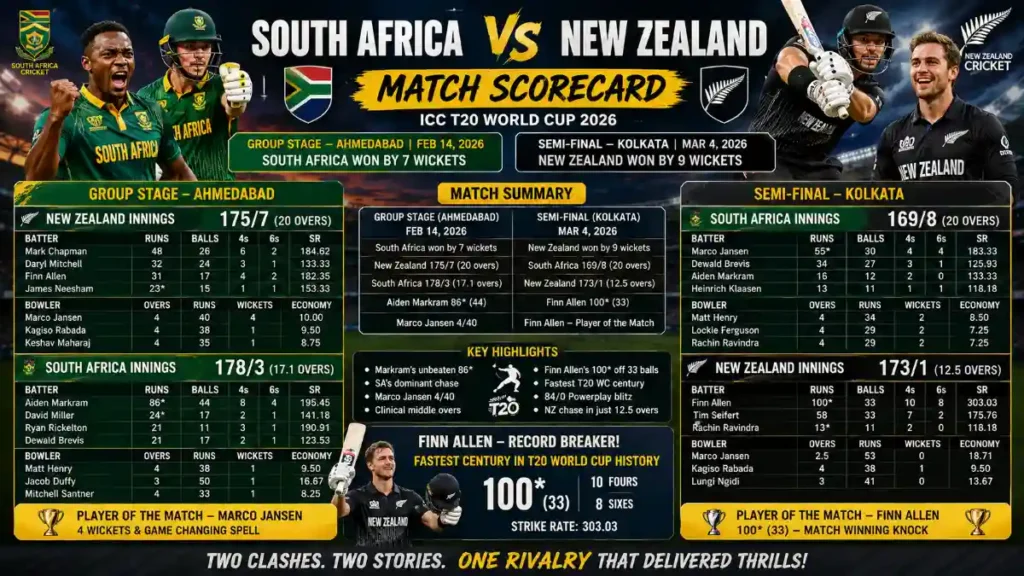
New Zealand beat South Africa by 9 wickets in the 1st semi-final at Eden Gardens, Kolkata, on March 4, 2026, chasing down 170 in just 12.5 overs. Finn Allen smashed the fastest century in T20 World Cup history (100 off 33 balls) to end South Africa’s unbeaten run. Earlier in the tournament, South Africa had defeated New Zealand by 7 wickets in the group stage at Ahmedabad, with Aiden Markram’s unbeaten 86 guiding the chase. Both matches featured contrasting tactical approaches, powerplay execution, and individual brilliance that defined the tournament’s knockout drama.
Match Summary at a Glance
ICC T20 World Cup 2026 witnessed two completely different outcomes when South Africa and New Zealand faced each other. The group stage encounter saw clinical execution from the Proteas, while the semi-final belonged entirely to Finn Allen’s record-breaking assault.
Group Stage Match – Ahmedabad (February 14, 2026)
Match Result: South Africa won by 7 wickets (17 balls remaining)
| Team | Score | Overs | Run Rate |
| New Zealand | 175/7 | 20.0 | 8.75 |
| South Africa | 178/3 | 17.1 | 10.37 |
Key Performers:
- Aiden Markram (SA): 86* (44 balls) — 8 fours, 4 sixes
- Marco Jansen (SA): 4/40 (4 overs)
- Mark Chapman (NZ): 48 (26 balls)
Player of the Match: Marco Jansen
Semi-Final – Kolkata (March 4, 2026)
Match Result: New Zealand won by 9 wickets (43 balls remaining)
| Team | Score | Overs | Run Rate |
| South Africa | 169/8 | 20.0 | 8.45 |
| New Zealand | 173/1 | 12.5 | 13.46 |
Key Performers:
- Finn Allen (NZ): 100* (33 balls) — 10 fours, 8 sixes, SR 303.03
- Tim Seifert (NZ): 58 (33 balls) — 7 fours, 2 sixes
- Marco Jansen (SA): 55* (30 balls)
Player of the Match: Finn Allen
Detailed Scorecard – Group Stage (Ahmedabad)
New Zealand Innings – 175/7 (20 overs)
Fall of Wickets:
- 28/1 (Tim Seifert, 3.2 ov)
- 67/2 (Rachin Ravindra, 7.4 ov)
- 89/3 (Finn Allen, 9.5 ov)
- 112/4 (Daryl Mitchell, 13.2 ov)
- 143/5 (Mark Chapman, 16.3 ov)
- 156/6 (Glenn Phillips, 18.1 ov)
- 164/7 (Mitchell Santner, 18.5 ov)
Top Batters:
- Mark Chapman: 48 (26) — 6×4, 2×6
- Daryl Mitchell: 32 (24) — 3×4, 1×6
- Finn Allen: 31 (17) — 4×4, 2×6
- James Neesham: 23* (15) — 1×4, 1×6
Bowling Analysis (South Africa):
- Marco Jansen: 4-0-40-4
- Kagiso Rabada: 4-0-38-1
- Keshav Maharaj: 4-0-35-1
- Lungi Ngidi: 4-0-31-0
- Aiden Markram: 2-0-18-1
- Dewald Brevis: 2-0-13-0
Powerplay Score: 52/2 (6 overs)
Death Overs (16-20): 63/5
South Africa Innings – 178/3 (17.1 overs)
Fall of Wickets:
- 54/1 (Ryan Rickelton, 5.2 ov)
- 102/2 (Tristan Stubbs, 10.4 ov)
- 131/3 (Dewald Brevis, 13.1 ov)
Top Batters:
- Aiden Markram: 86* (44) — 8×4, 4×6, SR 195.45
- David Miller: 24* (17) — 2×4, 1×6
- Ryan Rickelton: 21 (11) — 3×4, 1×6
- Dewald Brevis: 21 (17) — 2×4, 1×6
Bowling Analysis (New Zealand):
- Matt Henry: 4-0-38-1
- Lockie Ferguson: 3.1-0-33-0
- Jacob Duffy: 3-0-50-1
- Mitchell Santner: 4-0-33-1
- James Neesham: 2-0-15-0
- Rachin Ravindra: 1-0-9-0
Powerplay Score: 63/1 (6 overs)
Target Chase: Achieved in 17.1 overs
Tactical Breakdown – Ahmedabad Match
South Africa dominated the chase through three critical phases:
- Powerplay dominance: 63/1 set the platform with aggressive intent
- Middle-over acceleration: Markram’s 19-ball fifty changed momentum entirely
- Death-over control: Required only 12 runs from the final 3 overs
New Zealand’s bowling lacked penetration in the middle overs, allowing Markram to manipulate field placements and rotate strike effortlessly. The Proteas never fell behind the required rate after the 8th over.
Detailed Scorecard – Semi-Final (Kolkata)
South Africa Innings – 169/8 (20 overs)
Fall of Wickets:
- 16/1 (Aiden Markram, 2.3 ov)
- 48/2 (Ryan Rickelton, 5.5 ov)
- 63/3 (Tristan Stubbs, 8.2 ov)
- 71/4 (Heinrich Klaasen, 9.4 ov)
- 77/5 (David Miller, 11.1 ov)
- 114/6 (Dewald Brevis, 15.3 ov)
- 138/7 (Kagiso Rabada, 17.5 ov)
- 169/8 (Lungi Ngidi, 19.6 ov)
Top Batters:
- Marco Jansen: 55* (30) — 4×4, 4×6
- Dewald Brevis: 34 (27) — 3×4, 1×6
- Aiden Markram: 16 (12) — 2×4
- Heinrich Klaasen: 13 (11) — 1×6
Bowling Analysis (New Zealand):
- Matt Henry: 4-0-34-2
- Lockie Ferguson: 4-0-29-2
- Rachin Ravindra: 4-0-29-2
- Cole McConchie: 1-0-9-2
- Mitchell Santner: 4-0-33-0
- Jacob Duffy: 3-0-35-0
Powerplay Score: 48/2 (6 overs)
Death Overs (16-20): 55/3
New Zealand Innings – 173/1 (12.5 overs)
Fall of Wickets:
- 117/1 (Tim Seifert, 10.2 ov)
Top Batters:
- Finn Allen: 100* (33) — 10×4, 8×6, SR 303.03
- Tim Seifert: 58 (33) — 7×4, 2×6
- Rachin Ravindra: 13* (11) — 2×4
Bowling Analysis (South Africa):
- Marco Jansen: 2.5-0-53-0
- Kagiso Rabada: 4-0-38-1
- Lungi Ngidi: 3-0-41-0
- Keshav Maharaj: 3-0-41-0
Powerplay Score: 84/0 (6 overs) — highest in T20 World Cup history
Opening Partnership: 117 runs (Allen & Seifert)
Tactical Breakdown – Semi-Final
New Zealand executed a near-flawless chase built on three pillars:
- Powerplay annihilation: 84/0 in 6 overs removed all pressure
- Allen’s assault: Hit boundaries at will, targeted bowlers’ lengths ruthlessly
- Zero dot-ball pressure: Allen faced just 7 dot balls in 33 deliveries
South Africa’s bowling crumbled under relentless assault. Jansen conceded 53 runs without a wicket, while Ngidi and Maharaj combined for 82 runs across 6 overs. The Proteas had no answer to Allen’s timing, placement, and sheer audacity.
Finn Allen’s Record-Breaking Century
Finn Allen’s 100* off 33 balls rewrote T20 World Cup history. He became the first player to score a century in a T20 World Cup knockout match and delivered the fastest hundred in tournament history, surpassing Chris Gayle’s 47-ball effort against England in 2016.
Allen’s Milestone Breakdown
| Milestone | Balls | Time |
| 0-50 | 19 | 15 minutes |
| 50-100 | 14 | 8 minutes |
| Total | 33 | 23 minutes |
Phase-wise Scoring:
- Powerplay (1-6 overs): 71* (20 balls) — 8 fours, 4 sixes
- Middle overs (7-12 overs): 29* (13 balls) — 2 fours, 4 sixes
Boundary Distribution:
- Fours: 10 (40 runs)
- Sixes: 8 (48 runs)
- Singles/Twos: 12 runs
Allen targeted specific bowlers with surgical precision, hitting Jansen for 27 runs in one over and consistently finding gaps against Maharaj’s spin. His footwork against pace and ability to create room against yorkers showcased elite skill execution under pressure.
Aiden Markram’s Masterclass in Ahmedabad
Aiden Markram’s unbeaten 86 off 44 balls remains one of the finest T20I chases in recent memory. His innings featured technical mastery, intelligent shot selection, and calculated aggression that never crossed into recklessness.
Markram’s Innings Breakdown
Scoring Zones:
- Off-side: 52 runs (12 boundaries)
- Leg-side: 34 runs (4 boundaries)
Phase-wise Contribution:
- Powerplay: 28* (14 balls)
- Middle overs (7-15): 48* (23 balls)
- Death overs (16-17.1): 10* (7 balls)
Markram reached his fifty in just 19 balls, the joint-fastest in T20 World Cup history. He manipulated New Zealand’s field by targeting third-man and backward point repeatedly, forcing defensive adjustments that opened up leg-side boundaries.
Marco Jansen – The Dual-Impact Star
Marco Jansen delivered match-winning contributions in both encounters, showcasing his all-round capabilities across formats.
Jansen’s Tournament Impact
| Match | Bowling | Batting | Impact |
| Ahmedabad | 4/40 (4 ov) | Did not bat | Player of Match |
| Kolkata | 0/53 (2.5 ov) | 55* (30) | SA’s top scorer |
In Ahmedabad, Jansen’s four wickets dismantled New Zealand’s top order, removing Seifert, Ravindra, Allen, and Phillips at crucial moments. His ability to extract bounce and movement troubled every batter.
In Kolkata, Jansen rescued South Africa from complete collapse. Walking in at 77/5, he counter-attacked with authority, hitting 4 fours and 4 sixes to add 92 runs in the final 9 overs alongside lower-order partners.
Powerplay Comparison – The Defining Factor
Powerplay execution separated the two matches and determined final outcomes.
| Match | Team | PP Score | Wickets | Run Rate |
| Ahmedabad | NZ batting | 52/2 | 2 | 8.67 |
| Ahmedabad | SA chasing | 63/1 | 1 | 10.50 |
| Kolkata | SA batting | 48/2 | 2 | 8.00 |
| Kolkata | NZ chasing | 84/0 | 0 | 14.00 |
New Zealand’s 84/0 powerplay in Kolkata remains the highest powerplay score in T20 World Cup history. Allen alone scored 71 runs in those six overs, matching the entire team’s totals from previous World Cup matches.
Death Overs Analysis
Both teams struggled in the death overs when batting first but excelled when chasing.
Ahmedabad Death Overs (16-20)
- New Zealand: 63/5 — lost momentum after Chapman’s dismissal
- South Africa: 15/0 (16-17.1 overs) — controlled finish
Kolkata Death Overs
- South Africa: 55/3 (16-20) — Jansen’s assault
- New Zealand: Match finished in 12.5 overs
The team batting second controlled death-over pressure better in both matches, suggesting the chasing advantage was significant on both surfaces.
Head-to-Head Tournament Summary
| Metric | Ahmedabad | Kolkata |
| Toss winner | SA (chose to field) | NZ (chose to field) |
| First innings total | 175/7 (NZ) | 169/8 (SA) |
| Winning margin | 7 wickets, 17 balls | 9 wickets, 43 balls |
| Powerplay winner | South Africa | New Zealand |
| Highest individual | Markram 86* | Allen 100* |
| Best bowling | Jansen 4/40 | McConchie 2/9 |
Both matches saw the chasing team dominate comprehensively, but New Zealand’s semi-final chase was historically exceptional in margin and execution speed.
Women’s Cricket Context – AUS vs IND
While men’s T20 World Cup action unfolded, the Australia women’s national cricket team vs India women’s national cricket team match scorecard from recent encounters showcased similarly dramatic contrasts. Women’s cricket has witnessed exceptional individual performances and tactical battles, much like the SA vs NZ clash. Australia women’s national cricket team vs India women’s national cricket team match scorecard from bilateral series and ICC tournaments reflects evolving strategies in powerplay batting and death-over execution—tactical elements that defined the SA-NZ encounters. Comparisons between australia women’s national cricket team vs india women’s national cricket team match scorecard trends and men’s tournament patterns reveal universal T20 principles: powerplay dominance, middle-over control, and death-over finishing.
What Separated Victory from Defeat
Three factors determined match outcomes:
- Powerplay execution: The team winning the power play won both matches
- Middle-order stability: Partnerships between overs 7-15 proved decisive
- Individual brilliance: Markram (Ahmedabad) and Allen (Kolkata) delivered match-winning performances
South Africa’s semi-final collapse exposed their middle-order fragility. Losing Markram, Rickelton, Stubbs, Klaasen, and Miller between overs 2-11 left them with an insurmountable deficit despite Jansen’s heroics.
New Zealand’s tactical discipline in the semi-final was flawless. Mitchell Santner rotated bowlers intelligently, maintained pressure through disciplined lines, and never allowed South Africa’s power hitters to settle.
Tournament Impact and Legacy
The semi-final result ended South Africa’s dream of an unbeaten World Cup campaign. They had won 11 consecutive matches before facing New Zealand in Kolkata, building momentum across the group stages and Super 8s.
New Zealand advanced to the final, where they faced either England or India on March 8, 2026. Their semi-final performance announced them as genuine title contenders capable of dismantling any opposition on their day.
Finn Allen’s century will be remembered as one of cricket’s greatest knockout innings, comparable to Yuvraj Singh’s six sixes, Ben Stokes’ Headingley heroics, and Carlos Brathwaite’s four consecutive sixes. His strike rate of 303.03 in a semi-final chase represents fearless execution at the highest pressure point.
Key Records Set
Fastest T20 World Cup Century:
- Finn Allen: 33 balls (previous: Chris Gayle 47 balls)
Highest Powerplay Score (T20 World Cup):
- New Zealand: 84/0 vs South Africa
First Century in T20 World Cup Knockout Match:
- Finn Allen: 100* (33)
Fastest T20I Fifty (Joint Record):
- Aiden Markram: 19 balls (equals Yuvraj Singh)
Most Runs in Semi-Final Chase (T20 World Cup):
- Finn Allen: 100*
Frequently Asked Questions
Q1. Who won the South Africa vs New Zealand T20 World Cup 2026 semi-final?
New Zealand won by 9 wickets at Eden Gardens, Kolkata, on March 4, 2026, chasing 170 in just 12.5 overs with Finn Allen scoring an unbeaten 100 off 33 balls.
Q2. What was Finn Allen’s score in the T20 World Cup 2026 semi-final?
Finn Allen scored 100* off 33 balls with 10 fours and 8 sixes at a strike rate of 303.03, the fastest century in T20 World Cup history.
Q3. Who won the group stage match between South Africa and New Zealand?
South Africa won by 7 wickets at Narendra Modi Stadium, Ahmedabad, on February 14, 2026, with Aiden Markram scoring an unbeaten 86 off 44 balls.
Q4. What was the highest power play score in the SA vs NZ matches?
New Zealand scored 84/0 in the powerplay during the semi-final chase at Kolkata, the highest powerplay score in T20 World Cup history.
Q5. Who was the Player of the Match in both SA vs NZ encounters?
Marco Jansen won Player of the Match in Ahmedabad for his 4/40 bowling performance. Finn Allen won it in the semi-final for his record-breaking century.
Q6. What was South Africa’s total in the semi-final?
South Africa scored 169/8 in 20 overs, with Marco Jansen’s unbeaten 55 off 30 balls rescuing them from 77/5.
Q7. Did South Africa remain unbeaten in the T20 World Cup 2026?
No. South Africa’s 11-match unbeaten streak ended in the semi-final against New Zealand in Kolkata.
Q8. What was the opening partnership between Allen and Seifert?
Finn Allen and Tim Seifert added 117 runs for the first wicket before Seifert was dismissed for 58 off 33 balls in the 11th over.
Q9. How many balls did New Zealand need to chase 170 in the semi-final?
New Zealand chased down 170 in 77 balls (12.5 overs), finishing with 43 balls remaining.
Q10. Who took the most wickets for South Africa in the group stage match?
Marco Jansen took 4 wickets for 40 runs in 4 overs, dismantling New Zealand’s top and middle order in Ahmedabad.