Twenty-seven all out. In a Test match. In 2025. That scoreline from Sabina Park, Kingston, is not just a number; it is the defining image of one of the most one-sided Test tours in recent memory. The Australian men’s cricket team vs West Indies cricket team match scorecard across this three-Test series tells a story of clinical efficiency meeting structural fragility. Australia did not simply win. They won three times, by increasing margins, in three different conditions, using three different match-winners.
If you are looking for the complete scorecard breakdown, player performances, tactical turning points, and what this series means beyond the result line,e this is the only page you need.
Series at a Glance Quick Stats Box
Australia Tour of West Indies 2025 Test Series Summary
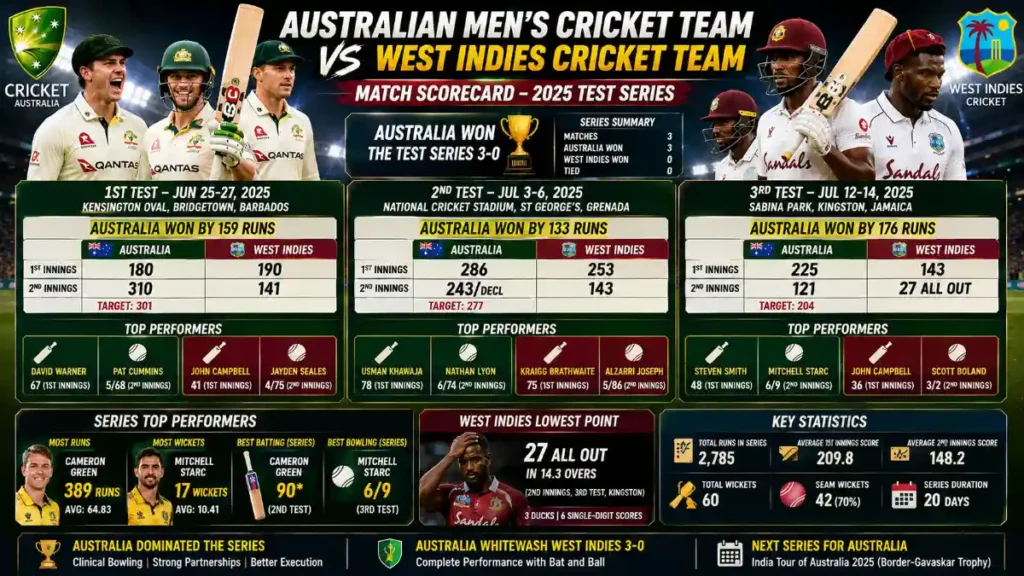
- Series Result: Australia won 3-0
- Margins: 159 runs, 133 runs, 176 runs
- West Indies lowest score: 27 all out (3rd Test, 2nd innings)
- Top run-scorer: Cameron Green (Australia) 389 runs
- Best bowling figures: Mitchell Starc 6/9 in 7.3 overs (3rd Test)
- T20I Series Result: Australia also won 5-0
- Venues: Bridgetown, St George’s, Kingston
Complete Match Scorecards Australia Tour of West Indies 2025
The full Australian men’s cricket team vs West Indies cricket team match scorecard across the three Tests reveals a clear pattern: West Indies competed in the first innings, then collapsed under second-innings pressure every single time. That is not bad luck. That is a batting structure problem.
1st Test Scorecard Kensington Oval, Bridgetown, Barbados (June 25–27, 2025)
Result: Australia won by 159 runs
| Innings | Team | Score |
| 1st Innings | Australia | 180 |
| 1st Innings | West Indies | 190 |
| 2nd Innings | Australia | 310 |
| 2nd Innings | West Indies | 141 (Target: 301) |
What most analysts missed: West Indies actually held a first-innings lead of 10 runs. They were in this match. The series was genuinely open after Day 2. The collapse that followed bundled out for 141 chasing 301 was not a result of Australia’s brilliance alone. It was the West Indies surrendering a position of strength.
Key Session Breakdown 1st Test
| Session | Dominant Side | Key Event |
| Day 1 Morning | West Indies | Australia restricted to 180 |
| Day 2 Afternoon | Australia | Momentum swung with quick wickets |
| Day 3 Morning | Australia | Chase was derailed in the first 10 overs |
Turning Point: West Indies’ openers were dismissed cheaply at the start of the second innings chase. From 20/2, no batter built beyond 35. Partnerships were the real killer, or rather, the absence of them.
2nd Test Scorecard National Cricket Stadium, St George’s, Grenada (July 3–6, 2025)
Result: Australia won by 133 runs
| Innings | Team | Score |
| 1st Innings | Australia | 286 |
| 1st Innings | West Indies | 253 |
| 2nd Innings | Australia | 243 (dec) |
| 2nd Innings | West Indies | 143 (Target: 277) |
The most competitive match of the series on paper. West Indies came within 33 runs of Australia’s first innings total. The crowd was alive. The contest was real.
But here is the real problem: West Indies needed to bat Australia out of the game in their second innings and then take wickets early in the chase. They did neither. Australia declared, set a target of 277, and the West Indies, starting with genuine confidence, fell 133 runs short, dismissed for 143. According to Cricbuzz, Nathan Lyon and Mitchell Starc combined to dismantle the West Indies middle order in the final session.
Key Turning Point: West Indies lost their 5th, 6th, and 7th wickets within 11 overs after the lunch break on Day 4. Each wicket came from a promising position. No batter crossed 40 in the second innings. That is the pattern that cost them the series, not the Kingston collapse.
Session Breakdown 2nd Test
| Session | Dominant Side | Key Event |
| Day 1–2 | Competitive | 33-run gap in 1st innings |
| Day 3 | Australia | Controlled declaration |
| Day 4 Afternoon | Australia | WI’s middle order dismantled |
3rd Test Scorecard Sabina Park, Kingston, Jamaica (July 12–14, 2025)
Result: Australia won by 176 runs
| Innings | Team | Score | Overs |
| 1st Innings | Australia | 225 | 70.3 |
| 1st Innings | West Indies | 143 | 52.1 |
| 2nd Innings | Australia | 121 | 37.0 |
| 2nd Innings | West Indies | 27 (Target: 204) | 14.3 |
Top Performers 3rd Test
| Player | Team | Performance |
| Steven Smith | Australia | 48 (66 balls) 1st innings anchor |
| John Campbell | West Indies | 36 (65 balls) highest WI score |
| Mitchell Starc | Australia | 6/9 in 7.3 overs (2nd innings) |
| Scott Boland | Australia | 3/2 in 2 overs (2nd innings) |
| Josh Hazlewood | Australia | 1/10 in 5 overs (2nd innings) |
West Indies 2nd Innings Fall of Wickets Timeline
| Wicket | Score | Batter |
| 1st | 0 | Dismissed for duck |
| 2nd | 0 | Dismissed for duck |
| 3rd | 0 | Dismissed for duck |
| 4th | 5 | — |
| 5th | 7 | — |
| 6th | 11 | — |
| 7th | 26 | — |
| 8th | 26 | — |
| 9th | 26 | — |
| 10th | 27 | Alzarri Joseph 4* (last batter standing) |
The collapse in numbers: 14.3 overs. 3 ducks. 6 single-digit scores. Bowling figures of 6/9, 3/2, and 1/10 from three different seamers. That is not a batting failure caused by one exceptional delivery. That is collective defensive disintegration under seam movement.
Sabina Park Pitch Context: The surface at Kingston has historically offered carry and lateral movement for seamers, particularly in the first and third sessions. However, the pitch on Day 3 was not unplayable. West Indies batters were caught in technical uncertainty, unsure whether to play or leave, committing to neither decisively.
The Real Turning Point: What Most Coverage Gets Wrong
Everyone is talking about the 27 all out. That is understandable. It is a historic number. But it was not the moment that decided this series.
The series was decided in Grenada, not Kingston.
In the 2nd Test, West Indies reached 253 in their first innings. They had restricted Australia. Momentum was level. Had West Indies built a second innings total of 280+ and set a target above 300, they would have entered the final Test at 1-1 with confidence and crowd backing.
Instead, they posted 143 in their second innings, surrendering not just the match but the psychological control of the entire series. Australia carried overwhelming momentum into Kingston because Grenada had already broken the West Indies’ belief. The 27 all out in Kingston was the final expression of that mental erosion, not the cause of it.
That is the causal chain most scorecards cannot show you. This one does.
Player Performance Breakdown
Batters Series Top Scorers (3-Test Series)
| Player | Team | Total Runs | Key Contribution |
| Cameron Green | Australia | 389 | Consistent middle-order anchor |
| Travis Head | Australia | 224 | Aggressive counter-attacking |
| Shai Hope | West Indies | 298 | Best WI batter, fought alone |
| Brandon King | West Indies | 289 | Only consistent WI opener |
| Alex Carey | Australia | 187 | Key lower-order contributions |
| Roston Chase | West Indies | 190 | WI’s most technically correct batter |
| Beau Webster | Australia | 150 | Crucial partnerships with Green |
Cameron Green’s 389 runs deserve to be discussed in the same breath as any match-winner from this tour. He was not the flashiest batter, but in three Tests across three different conditions, he was the most consistently decisive. Green batting at number six is a structural advantage no other Test nation currently replicates. His presence converts 260s into 310s and 180s into defendable totals.
Shai Hope’s 298 runs as wicket-keeper and stand-in captain for a 3-0 losing side is one of the quietly impressive individual performances of the 2025 season. He repeatedly top-scored in an outfit that collapsed around him. That is leadership under structural adversity.
Bowlers Series Wicket-Takers
| Player | Team | Key Figures | Context |
| Mitchell Starc | Australia | 6/9 (3rd Test 2nd inn) | Career-defining late-career spell |
| Scott Boland | Australia | 3/2 in 2 overs | Most economical figures of the series |
| Josh Hazlewood | Australia | Series-long consistency | 15+ wickets across tour |
| Shamar Joseph | West Indies | 4/34 (3rd Test 1st inn) | Showed genuine world-class potential |
| Alzarri Joseph | West Indies | Regular contributor | Best WI bowler in the series |
| Jayden Seales | West Indies | Series wickets | Promising but inconsistent support role |
Mitchell Starc’s 6/9 in 7.3 overs is the kind of bowling performance that gets remembered. Not because the conditions manufactured wickets automatically, but because Starc delivered precision reverse swing and yorkers at match-winning speed at age 35, on a tour where he was not expected to be the decisive figure. His ability to produce career-best spells in the fourth and fifth innings of Test matches remains unmatched among current left-arm seamers.
Shamar Joseph’s 4/34 in Australia’s first innings at Kingston also deserves recognition. On a day when West Indies needed a reason for optimism, Joseph’s spell provided one. The reality is that the West Indies’ bowling attack is not the problem; they have genuine match-winning capability. The problem sits squarely with batting depth.
Australia vs West Indies 2025 Series Analysis and WTC Impact
Australia’s 3-0 clean sweep across the Test series,s winning by 159, 133, and 176 runs respectively,y carries significant consequences beyond the Caribbean scorebook.
Three critical observations from this series:
First, Australia’s batting depth is now its primary weapon, not its pace attack. In none of the three Tests did a top-three batter score a dominant century. Instead, multiple mid-order batters contributed 50s and 60s that compounded into winning totals. That is harder to plan against than a single star performer.
The second West Indies have a bowling attack capable of competing at the highest level. Shamar Joseph, Alzarri Joseph, and Jayden Seales are not the reason this series was 3-0. The batting order’s failure to convert starts into partnerships across all six second innings is the structural issue that the West Indies coaching staff need to address before the next WTC cycle.
Third, the 5-0 T20I sweep confirms this was a format-wide performance gap, not a Test-specific problem. West Indies lack match-winners who can anchor innings under pressure across formats. That is a talent pipeline question that no single series result can fix.
WTC Points Impact: Australia’s clean sweep added significant points to their World Test Championship standings, keeping them firmly in WTC final contention. West Indies, earning zero points, remain anchored in the lower half of the WTC cycle table.
Series Statistics Key Numbers
| Metric | Australia | West Indies |
| Test Series Result | Won 3-0 | Lost 3-0 |
| T20I Series Result | Won 5-0 | Lost 5-0 |
| Top Run-Scorer | Cameron Green (389) | Shai Hope (298) |
| Best Bowling Figures | Starc 6/9 | Shamar Joseph 4/34 |
| Lowest Team Score | — | 27 (3rd Test, 2nd innings) |
| Win Margins | 159R, 133R, 176R | — |
| Matches won across the tour | 8 | 0 |